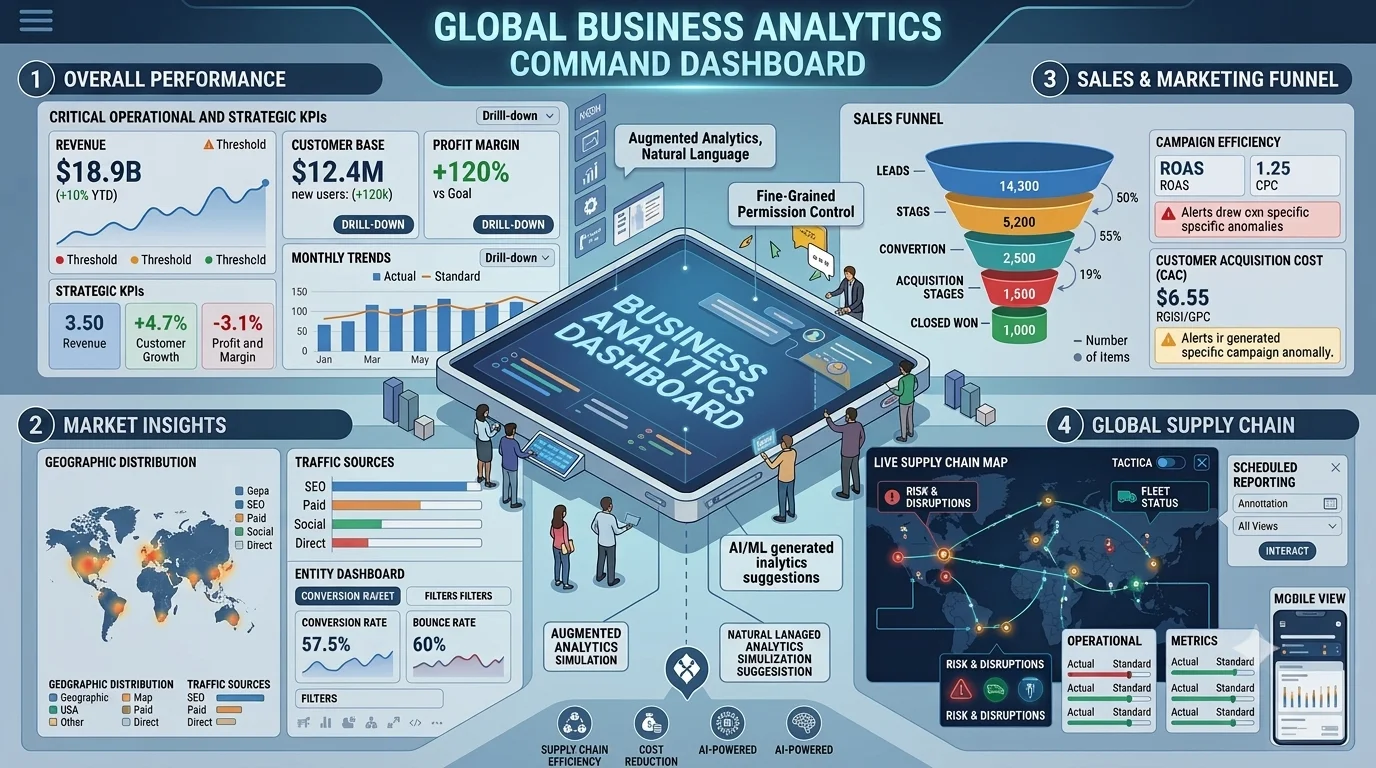
Business Analytics Dashboard
Real-time business intelligence driving data-informed decisions
A real-time analytics dashboard that transforms raw business data into actionable insights. Features interactive KPI visualizations, financial reporting, sales trend analysis, customer segmentation, and predictive analytics capabilities that empower leadership to make data-driven decisions.
Business Problem
Leadership lacked real-time visibility into business performance metrics. Reports were generated manually in spreadsheets, resulting in outdated information, inconsistent data sources, and a 48-hour delay between data generation and decision-making.
Solution
Developed a real-time analytics platform using Laravel with Chart.js for interactive visualizations, Redis for real-time data streaming, and a scheduled aggregation pipeline that processes millions of data points into meaningful KPI dashboards with drill-down capabilities.
Architecture
Event-driven analytics architecture with Data Ingestion Pipeline, Aggregation Engine, Cache Layer, and Presentation Service. Uses scheduled tasks for ETL processes, Redis pub/sub for real-time updates, and materialized views for sub-second dashboard loading across historical datasets.
Challenges
Processing and aggregating millions of data points without blocking the application, designing intuitive visualizations that convey complex data relationships, implementing real-time updates without excessive database polling, and building flexible date-range comparisons.
Performance Optimizations
Pre-aggregated summary tables reduced query complexity from 15-table joins to single-table lookups. Implemented lazy-loaded chart data with intersection observer, Redis sorted sets for real-time trending data, and query result caching with 5-minute TTL for dashboard widgets.